

If you have a website of your own, it is safe to imagine that you would want to know how good it is functioning once in a while.
By functioning, we do not explicitly mean if the website is technically functioning. Owners should check if the site is fetching the necessary traffic. This can be done using Google Analytics.
There are several plug-ins that you can integrate with your website to track social media traffic. This blog is a detailed discussion answering everything you want to know about Social Media Traffic.
Is This Necessary?
Why not? If you are a website owner, would you not want to know what is the best marketing strategy for you?
If you are already up and running with one, social media traffic will let you know if you are benefiting from it or not.
Just like surveys help marketers know what is the ongoing trend, following social media traffic will give you an insight into how much your site is in demand.
When a business owner shares a website in social media, it fuels traffic into your website. It can be paid traffic coming from ads and endorsements, or unpaid traffic from posts and messages.
Viewing Social Media Traffic Data In Google Analytics
There is a defined place where you can collate and view all your social media traffic data. This is the source medium report in Google Analytics.
This is a comprehensive report that gives an overview of each traffic source, how many viewers from that source visited your website, how are they reviewing the content, etc.
Getting The Access
To obtain access for this report, users have to log in to Google Analytics and select the website whose social media traffic report you are looking for.
Open the page and head over to Acquisition > All Traffic > Source/Medium.
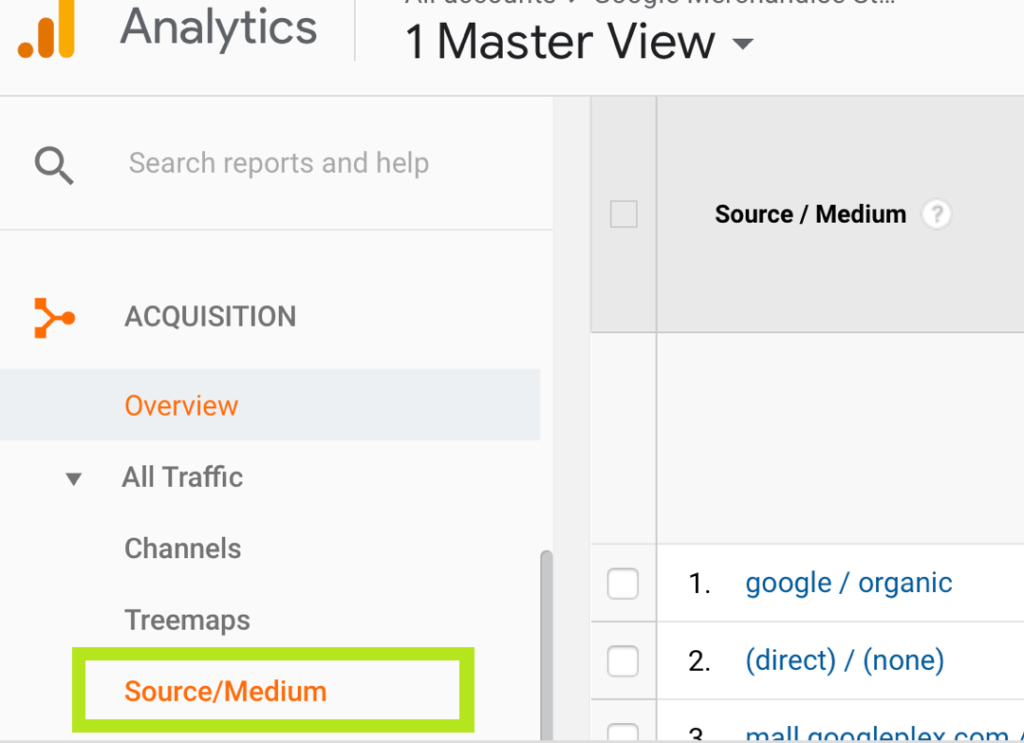
This page features all the sources from where your website gets traffic. Carefully look through the data categorised into several sections. An overview of the features is given below.
At the extreme left pane, there is a tab that talks about the source and the medium. For easy perception, you can think of ‘medium’ as the traffic type, and ‘source’ as the traffic brand.
For instance, in the list, you will discover the primary traffic source is termed google/organic, where, Google is the traffic brand, and organic is the type. Again, in google/CPC, Google is the traffic and CPC is the type. Here it is paid traffic.
Head over to the left taskbar that takes you to Acquisition->All Traffic->Channels. Discover a complete Channels report over here. These include how many users, how many new users, and how many up and running sessions.
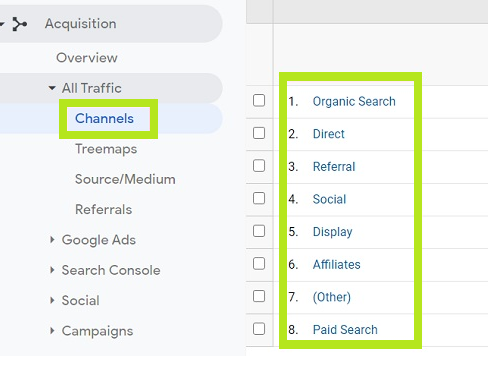
Next, visit the Social column.
This is the place where users can find all the data about social media traffic.
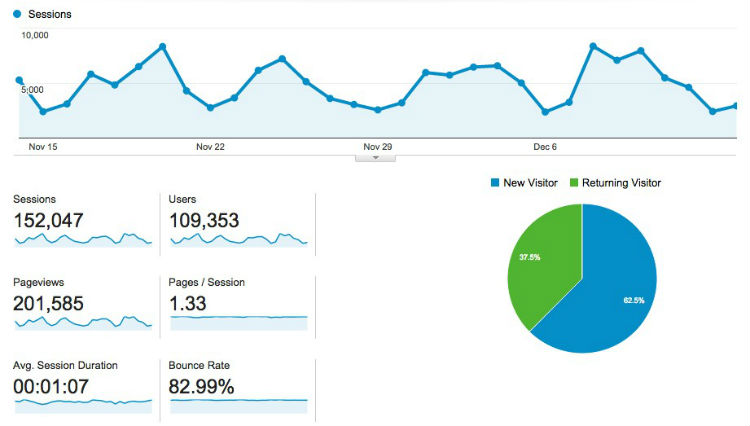
The next section where you can draw your attention is the Behaviour section. It draws up about the bounce rate, pages by session, and average session span for some audience.
The two major tabs – Acquisition and Behavior, are responsible for ascertaining the quality of traffic reaching your website.
Confused? This example will make it simpler.
Your traffic source can induce considerable traffic to the website. But a study suggests that most of the users refrain from action and exit the site. On the contrary, there can be a source which offers substantially less traffic, but the ones who visit go through the content with rapt attention. This shows that the second type is good quality traffic.
Now, we shall discuss the final section of report tracking.
Most of us set up goals and objectives in Google Analytics to gauge progress on leads or purchases. Do we not want to see the results? We can do that from the Conversions section.
Users have to choose a goal from the drop-down list to analyse traffic sources for various outcomes.
Analysis Of Your Readings
Until now, we have learnt how we can figure out data in our report. But we don’t know how to analyse it.
First things first, do not look at the numbers in your report as they can be deceptive. Instead, one should look for the trend.
Observe the Behavior data in your report and pick out the traffic sources that highlight the lowest bounce rates. The sites with lowest bounce rates contribute to the fact that audiences from those sources seldom hop away from the website as they find the content engaging compared to other websites on the web.
Column heads such as pages per session and average session duration are next for your observation. These traffic sources describe if the readers inspected numerous pages on average or wasted extra time on one site.
This analysis brings you to one conclusion that you can ensure how attentive the readers are while going through your content. So what’s the next job? You need to figure out the translated results.
Look at the transactions that are taking place on your website and your net income out of it. It is observed that two sites with similar engagement levels can also generate different revenues.
If we get such results from Google Analytics, we can infer that one source works better than the other. Once a user has learnt the basic concepts of traffic, he or she can start tagging traffic by themselves.
Interpretation Of The Data
Social Media Traffic interpretation can take place as per the parameters set by the user. Without any consent, Google Analytics report represents the real social media traffic data in a tabular view. The user is at liberty to change how the report displays.
Let us look at the different view types in Google Analytics.
- Percentage: In a pie chart representation, it shows the distribution of traffic.
- Performance: Relative performance of the chosen attribute is represented in the form of horizontal bars.
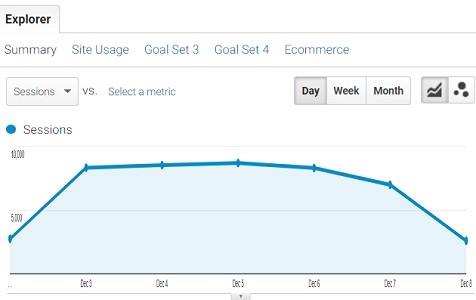
- Comparison: A bar chart helps you to draw an analogy between multiple metrics and determine the best performer.
- Term cloud: If you want to see a visual of the keywords used in your website, then you can find them here. It helps the business user set up SEO parameters for the site.
- Pivot: If you are in a fix while trying to figure out the data trends, then you need pivot analysis of your reports. It helps users to redistribute the data in the schema.
An instance
If a user with a social media eCommerce site wants to track, which contributes to what percentage in the sales. You can get the data in many different ways.
Social media traffic can generate the percentage view in your report. To behold that report follow the navigation below.
- Click on the Percentage inside the social media view.
- Select your primary metric – Transactions.
- Hover to contribution to the total field
- Select Revenue.
You will be able to generate a personalised report based on the transactions that you have encountered. Additionally, a pie chart will be present that details how each SNS is helping you to generate what percentage of income.
This way, by using views, you can easily present a customised report and learn social media traffic data channelling to your website.
Custom URL For Social Media Reporting
So far, we have discussed a common way to generate reports on social media traffic using Google Analytics. But hang in there. There is another way to do that.
Users can create custom URLs with UTM codes to track their traffic. These UTM tags are attached to the shareable links on social media.
Readers might wonder, why should they use a UTM tag?
With a UTM tag, the users can make use of the UTM parameters. These parameters help them to strategise the website marketing in such a way so that they can attract a huge crowd.
Engaging a crowd on your website is not a piece of cake. Viewers are quick to react in what they do not like and leave the page in a few minutes.
Thus, this parameter will help a business figure out crowd engagement and innovate solutions to drive traffic. Traffic to website and revenue are directly proportional, so business users must learn details about the purchase, etc.
A simple instance will make it easier to comprehend. While using a Facebook campaign, we seek lots of visitors to our Mostly, to spread the word, we make use of advertisements. Most of these ads help to generate revenue by the PPC method.
To estimate the revenue collected from such ads, we use analytics and reporting. It also answers a few FAQs such as – which ad provides the maximum page views after the first click?
Earlier, in this blog, readers got to know how they can use GA to view reports. Now, they will learn how they can structure those reports with UTM tagging.
The parameters are:
- Product/Service: It talks about the product or service which is promoted or from where traffic is generated.
- Brand: The brand is the label which tells you which kind of traffic you are gaining from reputed social media platforms like Facebook, YouTube, Twitter, Instagram, etc.
- Type: If the traffic is paid or unpaid, shared or organic – all these details are enlisted under type
- Headline: Talks about the subject of the traffic
- Details: encompasses other details
Can You Create A Custom UTM
Indeed you can. Templates are always there to make our work easier, but developers never forget to leave the scope for enthusiasts to create their own tags.
But how to do that?
It’s no rocket science.
You can try by creating a unique link by doing the following. Insights->Tools->URL Builder->URL parameters
The user needs to start by opening the UTM builder and follow the steps mentioned.
- Go to File
- Duplicate the UTM using “Make a Copy” option
The primary tab narrates the utilities of UTM building tips.
Next is the phase where users can customise the page.
- Start by navigating to open the Traffic Tag Settings tab.
- Here a user needs to configure the core traffic tag settings.
- Hover to the “Source” column to list the exemplary social networking sites which drive traffic viz. FB, Instagram, YT
- Hover to the “Medium” column to add traffic types viz. CPC, share, email, etc.
- Navigate to the campaign column to describe in lists the products and services offered by the business.
Where do these details you enter go? There are all present under the respective tabs of sources, mediums, and campaigns inside a drop-down list.
The last piece of work, before you can create your custom UTM is done, and you are good to go. You can easily create and personalise your UTMs.
For better understanding, here in this blog, we will try to create the UTM for Facebook.
The first step is to open the Facebook-CPC tab.
You will sight the URL section in the application where you have to carefully put in the URL of the landing page of the advertisement.
Once that is done, you should make a selection of the appropriate social media traffic source from the prompt table presented.
Select the medium (CPC) and campaign (academy) particulars from the subsequent drop-down tables.
Enter the details of your term and your content subsequently.
As the work progresses, at the back end, a spread will generate a comprehensive analytical report for you. It will create an URL for the user and code.
Click on the code and test the spreadsheet to check your report.
Congratulations! You have successfully built a report on social media traffic to your website, and you did not even require a programmer.
Isn’t that great?
Wrap Up
For an online business to grow, it is necessary to figure out how you can engage people. You cannot remain oblivious to the fact that netizens might not like your website.
Trust Google Analytics, as it gives you accurate results of social media traffic. It will help you find out the shortcomings in your business and help it flourish.
About the Author
Jainish Vora is Author at Phoneier. Having experience with 5 years of writing about phones and other gadgets. He loves to explore and write different gadgets from android phones to wearable gadgets.