

In an increasingly competitive digital marketing landscape, marketers need to rise up to new challenges. Search Engine Optimization (SEO) now allows for very few, if any, underhanded tactics, calling for pure quality instead. In turn, such link-building methods as guest blogging underperform for many compared to the days of old. Multiple factors make up this new reality, from a relative saturation to stricter standards and more. But be that as it may, it constitutes a genuine challenge to overcome. So, are there tactics that may still bolster your link-building strategies without strenuous effort? Yes, although effort toward value can never leave the equation. Specifically, you may use guestographics to earn backlinks effectively, as we’ll argue in this article.
What are guestographics?
First and foremost, let us briefly examine the term itself. “Guestographic”, as you might’ve assumed, is a portmanteau of “guest” and “infographic”.
Some argue that it was Backlinko’s Brian Dean who coined the term in 2016. Others, like Venngage, claim they coined it themselves as a term for internal use. Thus, it may be hard to pinpoint where exactly the term originated – but this matters little beyond well-deserved coinage acknowledgments. That is, in most cases, the term seems to refer to the same practice with minor twists.
Guestographics, then, refer to guest-submitted, or guest-made, infographics. However, how one may use guestographics to earn backlinks isn’t as simple as submitting infographics to other sites. To cite the aforementioned parties, Brian Dean elaborates on his method as such:
“It’s a link-building technique that uses infographics in a new way. Instead of publishing an infographic and begging other people to share it, you’re enticing them to publish it on their site[.]With the Guestographic Method, you’re offering them a free “mini guest post” to go along with the infographic”.
Instead, Venngage defines it as such:
“A ‘Guestographic’ is […] an infographic that we collaborate on with a potential partner, or as a value add to driving natural links to pages on a website”.
As you can see, in both definitions, guestographics hinge on adding value, as highlighted in the introduction. That is, they seek to meet the standards of sites that don’t readily accept backlinks to other sites by:
- Adding value to their posts through data visualization, and
- Adding even more value through accompanying material.
That’s just the definition and basic concept, however. There are multiple steps to correctly use guestographics to earn backlinks, especially given the current digital marketing trends.
Why backlinks matter, and why guestographic backlinks work
But first, let us briefly address the aforementioned backlink standards and the very value of backlinks themselves. In doing so, we’ll elaborate on both the merits of guestographics and why they’re worth your time, to begin with.
Initially, backlinks themselves are crucial for SEO, and a practical benefit even outside of it. As Backlinko notes, backlinks are among the 13 most notable SEO metrics, for 3 main reasons:
- Page quality. The number of backlinks a page gets denotes quality in the eyes of search engines.
- Page subject. Through backlinks’ anchor texts, search engines can better understand a page’s subject matter.
- Page authority. Finally, Follow links, in particular, allow for authority transfers, where authoritative sites linking to yours boosts your Domain Authority (DA). Marketers may refer to this as “link juice” transfer.
The latter part is why many high-DA sites will set high backlink standards, as backlinks function as effective endorsements. To avoid harm to their reputation, then, they will typically tag backlinks as NoFollow ones. Backlinks tagged as NoFollow will prevent DA transfers, and this is what its HTML code will look like:
<a href=”https://example.com” rel=”nofollow”>example anchor text</a>
Instead, Follow backlinks will appear like this:
<a href=”https://example.com”>example anchor text</a>
Still, both Follow and NoFollow backlinks will yield traffic. Moreover, healthy backlink profiles need both to appear natural and avoid potential ranking penalties.
In this sense, then, using guestographics to earn backlinks works for two main reasons:
- It adds undeniable value, ensuring a backlink is earned at all, and
- It’s done through direct communication, increasing the likelihood of a Follow backlink.
Finally, guestographic backlinks are not subject to the infamous infographic backlink devaluation. This belief seems to originate from a 2012 interview with Matt Cutts, which specifically refers to automatic “embed links”. The difference between those and guestographic backlinks is simple, and twofold; one, guestographic backlinks are not automatic, and two, they are framed by relevant, valuable content.
So, to summarize this section, backlinks are indeed well worth your time, SEO-wise and otherwise. Moreover, guestographics present excellent backlink opportunities, precisely because the practice begins by acknowledging the SEO context and implications of link-building. Should you still have doubts about the efficiency of this method, Brian Dean’s results should speak for themselves:

Making a great infographic
Now, to effectively use guestographics to earn backlinks, there are two main steps to take. First, you must produce a valuable infographic – then, and only then, you must pitch it to other sites. Remember, the entire concept of guestographics is to provide contextual value to an already valuable piece of content.
That said, both steps are far from simple, so let’s begin by covering the former.
#1 Pick a relevant subject
Initially, you will need to pick a subject for your infographic. There are a few different ways to approach this fundamental first step, and some are complementary to one another. So, let us explore the 3 most notable ones.
Use your own keyword research and analytics
An excellent starting point is to dig into your own audience insights. Should you be engaging in SEO, you likely have a clear view of which keywords best resonate with your audiences. Thus, you may use those insights to answer such questions as:
- Which general subjects do your audiences engage with most?
- Which specific keywords get the most engagement?
- Are there emerging trends your audiences may be interested in, based on historical data?
While rudimentary, those questions should give you a solid enough initial idea. In most cases, you will likely use guestographics to earn backlinks from authoritative websites within your niche and industry. Thus, what appeals to your audiences will often, but not definitively, appeal to theirs as well.
Analyze your candidates
Thus, since you can never be certain, you may analyze your candidates themselves. Granted, it may be unorthodox for some to first pick candidates and then design guestographics around them. However, if you’ve already narrowed down a list, you may analyze their audiences as you did yours.
Moreover, doing so will give you a solid frame of reference as regards quality. In essence, operating this way closely resembles Brian Dean’s skyscraper technique:
- “Step 1: Find link-worthy content
- Step 2: Make something even better
- Step 3: Reach out to the right people”
In this case, you will be identifying potential content gaps. That is, you will either be making “something even better” than what they’ve published, or you’ll be providing guestographics for relevant subjects they might be missing.
Search online
Finally, it’s equally wise to search online for infographic inspiration. Some starting points in this regard should be:
- Google. Always a reliable research tool, you may use Google to identify potentially valuable subjects. Consider plain keyword research and image search to gauge what the internet offers. You may find a given subject has been getting little attention, or it has only received low-quality infographics.
- Visual.ly. Another excellent tool for infographic research, Visual.ly offers a wealth of features for this task. There, you may sort through available infographics based on “trending” or “recent” status, views, favorites, and comments.
- Pinterest and Instagram. Finally, you may also use Pinterest, Instagram, and other visual-based social media platforms for infographic research. Some such platforms also offer similar search filters, so you may narrow down your results according to your needs.
In doing so, you may also discover data that informs your final result, in addition to the main subject. Of course, it’s always wise to accredit your sources if you also use data found in such infographics.
#2 Consolidate your information
Now, having concluded on your guestographic’s subject, you may begin to consolidate your information. The reason why infographics are so engaging is that we’re visual creatures, but not all data visualizations are equally effective. To use guestographics to earn backlinks, you will need to produce a solid, concise infographic.
In brief, data consolidation should account for the audiences it appeals to. Consider such questions as:
- Which data points are relevant to your audience?
- Are your chosen data points actionable or useful?
- Do your data points all serve the infographic’s purpose (ie educational, entertaining, etc.)?
These questions are crucial because your infographic needs to be brief to retain your audiences’ attention. Neil Patel warns against excessive infographic length as such, advising an 8,000-pixel limit:
“An infographic isn’t just a visualization of statistics and data. You have to have something to say. Think about your big idea and the audience you’re targeting. […] Don’t share stats and data just because you have them.”
This is indeed solid advice, as very few audiences care for every minute detail on a given subject. His suggestion of sticking to 7-10 data points should thus be a safe foundation, although you may settle for slightly more or slightly less depending on your own insights.
#3 Present it in a logical, digestible, pleasing fashion
Then, having settled on your data points, you will need to present them in a constructive way. As this section’s heading suggests, your infographic’s design and layout should have 3 key attributes:
- Logical structure. Your data points should flow in a logical manner. That is, your infographic’s title should typically be at the top, and your key message should follow. Then, your supporting data points and illustrations should frame it, followed by a key takeaway. Finally, your logo and sources should conclude your infographic. You may, of course, consider other structures, but you should always keep the logical flow of data in mind. In essence, a good infographic should be read as a story, with a proper introduction, conclusion, and key takeaways.
- Digestible size. Similarly, as outlined above, your infographic should remain digestible in size to maintain your audiences’ attention. Here, consider Neil Patel’s guidelines on limiting your data points to 7-10 and your infographic’s pixels to 8,000 or less. Then, depending on your audience insights, examine the possibility of limiting it further; is less actually more for your purposes? At times, it may be preferable to use few central data points than fluff it up without adding substantive value.
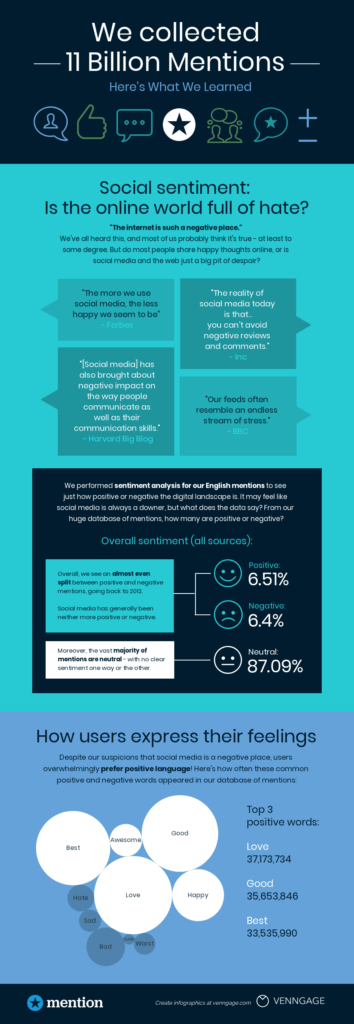
- Pleasing visuals. Finally, this point is arguably the least subjective one, as different visuals appeal to different audiences. Still, you may consider such objective measures as visual consistency. That is, your style and color choices should remain consistent throughout the infographic, instead of presenting the viewer with a fragmented collage. Similarly, you may divide different thematic sections through different colors and shapes, the way Venngage’s following infographic does:
Finally, to further ensure visual appeal, you may consider the psychology of colors and how it applies to your industry. In his guide to infographics creation, Neil Patel assigns different emotional connotations to different colors:
- Black; bold, stylish, draining, depressing.
- Red; love, passion, anger, hunger, intensity.
- Orange; excitement, enthusiasm, happiness, vitality, comfort.
- Yellow; cheerful, energetic, straining on the eyes.
- Green; tranquil, refreshing, well-being, complacent.
- Blue; calm, peaceful, stable.
- Neutrals; relaxing, grounding.
These are, of course, basic guidelines you may adjust and apply accordingly. For example, black may better denote professionalism in your industry, while orange may seem bland and unappealing.
Pitching a guestographic
Finally, having followed the process so far, you should now have a stellar infographic on your hands. Now, you will need to pitch it to your candidates, and turn it into an actual guestographic. Remember, simply contributing an infographic does not suffice for this practice.
Fortunately, this part of using guestographics to earn backlinks is much simpler. You will simply need to identify your candidates, pitch your infographic to them, and turn it into a complete guestographic.
#1 Identify your candidates
Initially, you will need to identify who you will pitch your work to. If you have done so already, using your existing candidates to inform your creation process, you may skip this step. Otherwise, there are two main ways to do so; plain Google, and third-party tools.
While comparatively modest in scope, Google can absolutely work in this regard. You may simply perform Google searches for the subjects you’ve built infographics for. For more accuracy, you may consider such factors as:
- Long-tail keywords. Depending on your infographic’s exact subject, it may be wiser to seek long-tail keywords. Short, high-value keywords may be more saturated and thus present steeper competition.
- Synonyms and related keywords. Similarly, you may find websites that host content adjacent to yours through keyword synonyms. Consider this very article, for example; it uses both “infographics” and “guestographics” as keywords.
- Google Suggest. Finally, Google’s suggestions may also offer a helping hand. They may, for instance, reveal long-tail keywords that might elude your initial searches. What’s more, they do typically reflect valuable search terms in themselves.
Of course, you may also have your own audience insights inform this step, as highlighted at the beginning.
Third-party tools
Alternatively, having touched on the skyscraper technique previously, you may also use third-party tools that see use for it. Such tools typically provide keyword insights, as well as other valuable analytics. Choices in this regard can include, among others, Ahrefs’ Site Explorer and Buzzsumo. Brian Dean elegantly summarizes how to use these tools for this purpose, by themselves or in tandem with Google search, in his video on the technique:
Link Building Case Study: How I Increased My Search Traffic by 110% in 14 Days
#2 Contact them
Then, you will naturally need to contact them. Of course, how you do so will ultimately depend on you, your candidates, your industry, and other personal factors. However, it’s arguably wise to adhere to standard marketing communication copy guidelines like:
- Personalize it. While some may not mind generic emails, others might refuse your offer if it’s seemingly spammy and general-use. Consider using the recipient’s name and their site name for some degree of personalization.
- Keep it brief. Much like your audiences, webmasters and editors may not take kindly to lengthy emails. You may, by all means, inject some character and details, but try to keep it brief and to the point. It is just a pitch, after all.
- Don’t pressure them. This, too, may be arguable, but many recipients will likely prefer a soft-sell approach.
#3 Offer to turn your infographic into a guestographic
Finally, should they agree, you’re ready to use guestographics to earn backlinks. All you will need to do now is to actually turn your infographic into a guestographic.
At this point, you’ve already offered them value through a free infographic that interests them and their audiences. Thus, the final allure should be to offer to frame it with a “mini guest post”, as Brian Dean puts it. Should they accept, you may frame your infographic with relevant, valuable text. To finalize the deal, you may maintain communications to iron out such aspects of it as:
- Ensure it adheres to their editorial standards from the start.
- Negotiate whether you’ll choose the backlink’s anchor text.
- Negotiate whether the backlink will be Follow or NoFollow; guestographic backlinks should typically be Follow ones, given their value.
Should this go smoothly, you won’t just have earned a valuable backlink from an authoritative source. In most likelihood, you will also have set a solid foundation for future collaboration opportunities – including for more backlinks.
Conclusion
In summary, it is no Herculean task to use guestographics to earn backlinks, but it’s no easy feat either. First, you will need to do research to determine your infographic’s subject. Then, you should craft it meticulously to ensure it is as accurate, engaging, interesting, digestible, and visually pleasing as possible. Finally, you will need to identify your candidates, successfully pitch it to them, and turn it into a proper guestographic. However, should you succeed, you will have earned a valuable backlink from an authoritative source. Moreover, you will likely have opened the door for future partnerships. Hopefully, while only rudimentary, this article should help you do just that.
About the author

Barbara Phillips is a freelance copywriter, an aspiring web developer, and an avid SEO practitioner. She frequently authors content for Link Department and other agencies, where she shares her experiences on link-building, on-page SEO, and similar subjects.